Dashboard
CRM Dashboard
The CRM Dashboard provides a comprehensive overview of all key metrics and activities within the CRM module in a single view. It displays essential information such as Leads, Contacts, Tickets, Deals, and includes graphical analytics for better visualization and insights.
Leads
The Leads section displays detailed information and analytics related to lead management. It includes the following components:
Total Leads Count: Displays the total number of leads in the system.
Total Open Leads Count: Shows the total number of open leads.
Today's Open Leads Count: Indicates the number of leads opened on the current day.
Open Leads in This Month Count: Shows the number of open leads created during the current month.
Open Leads in Past Month Count: Displays the number of open leads from the previous month.

Lead Generation
- This section provides a graphical representation of all leads and open leads, allowing users to track overall lead growth and activity trends.
Leads Created
- This chart displays the leads categorized by lead sources, helping users identify the most effective lead generation channels.
Lead Stage
- This section visualizes leads based on their current stage, providing insights into the lead conversion funnel.
Leads Converted to Contacts
- Displays a monthly graph showing the number of leads successfully converted into contacts during the selected time period.
Lead Status by Owner
- Presents a graphical report of leads categorized by their status and grouped by owner, helping assess team performance and workload.
Lead Stage by Owner
- Displays a chart showing the number of leads per owner, grouped according to their respective stages, offering a clear view of each owner's lead progress.
Contacts
The Contacts section provides detailed insights and analytics related to all contacts managed within the CRM. It includes both summary statistics and graphical representations to help track and evaluate contact-related activities.
Total Contacts Count: Displays the total number of contacts available in the system.
Total Open Contacts Count: Shows the total number of active or open contacts.
Today's Contact Count: Indicates the number of contacts created on the current day.
Contacts in This Month Count: Displays the total number of contacts created during the current month.
Contacts in Past Month Count: Shows the number of contacts created in the previous month.
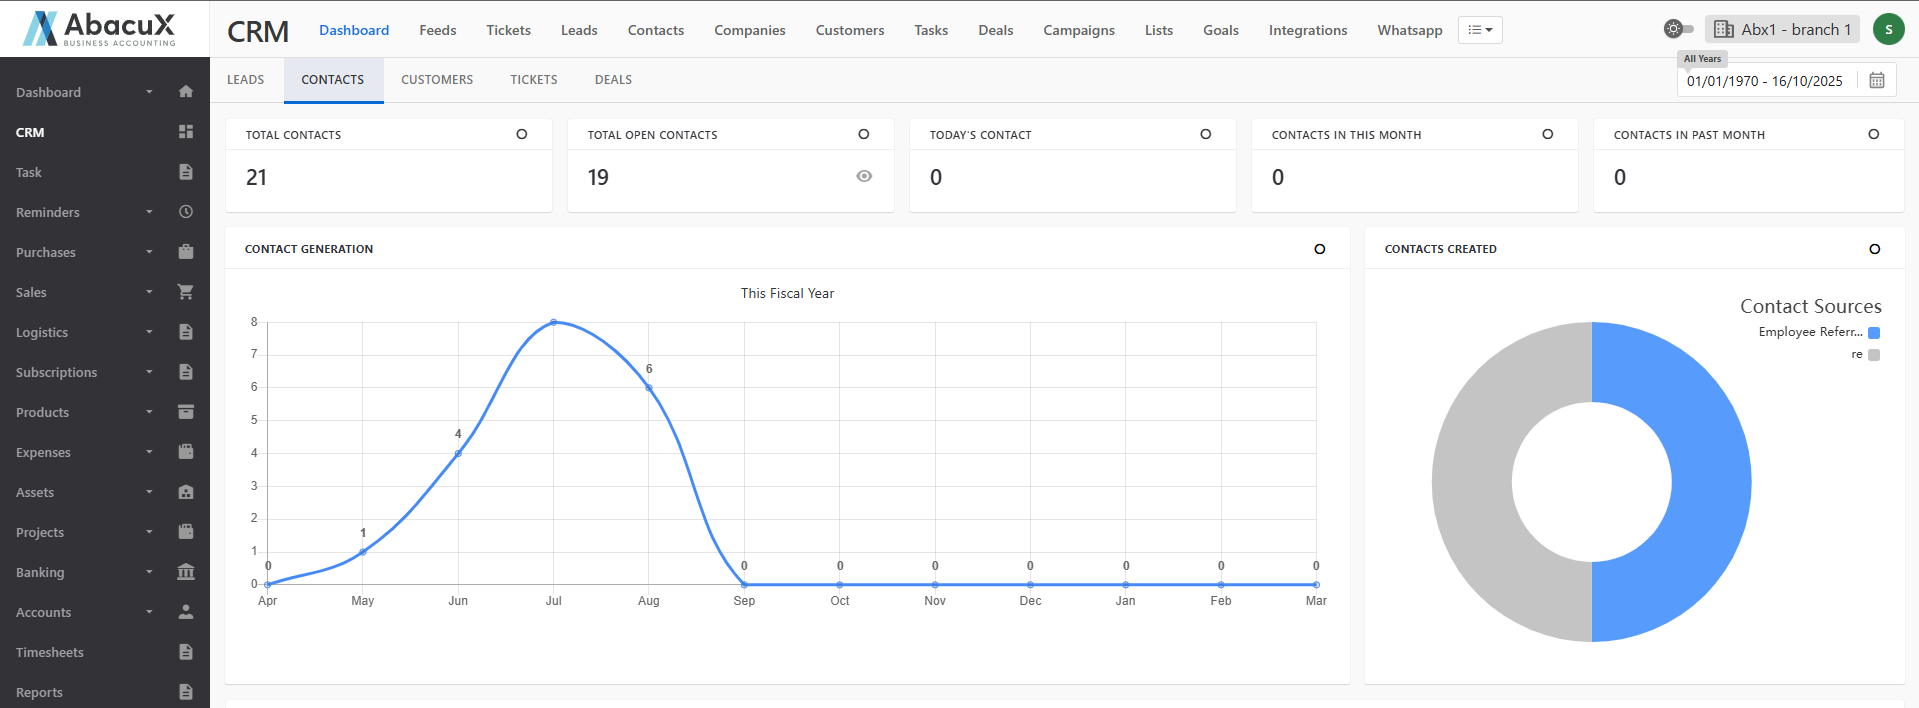
Contact Generation
- This section provides a monthly chart view representing the number of contacts created over time, helping to identify growth trends.
Contacts Created
- Displays a graphical representation of contacts created, categorized based on specific contact types or classifications.
Contact Stage
- This section shows a graphical view of contacts categorized according to their respective stages, offering insights into the contact management pipeline.
Contacts Converted to Customer
- Presents a graph showing the number of contacts converted into customers within the selected time period.
Contact Status by Owner
- Displays a chart showing each owner’s contacts, categorized by their current status, to evaluate team and individual performance.
Contact Stage by Owner
- Provides a graphical analysis of contacts grouped by owner and categorized based on their stages, offering a clear understanding of ownership and progression across the CRM.
Customers
The Customers section provides comprehensive insights into customer-related data and analytics, helping businesses track customer growth, engagement, and financial performance over time.
Total Customers Count: Displays the total number of customers recorded in the system.
Today's Customer Count: Shows the number of customers added on the current day.
Customers in This Month Count: Indicates the total number of customers added during the current month.
Customers in Past Month Count: Displays the number of customers added in the previous month.
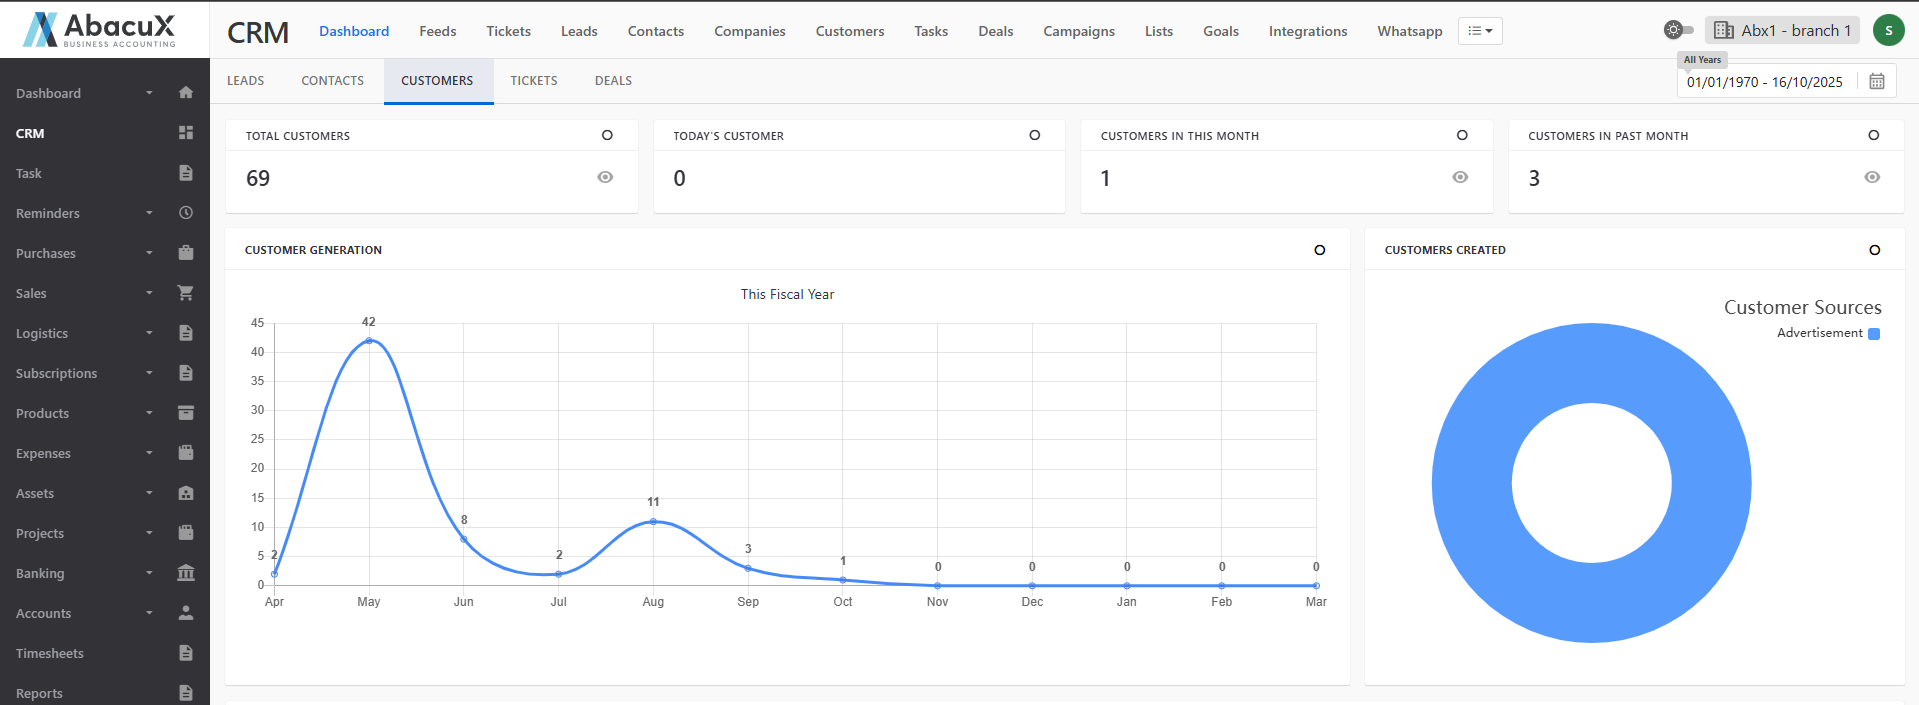
Customer Generation
- This section presents a chart view representing the total number of customers generated over a specific period.
Customers Created
- Displays a graphical representation of customers categorized based on their respective creation types or classifications.
Top 10 VIP Customers (Fiscal Year)
- Lists the top 10 VIP customers based on their total purchase value within the selected fiscal year.
Top 10 Number of Invoices Generated (Fiscal Year)
- Shows a graphical view of customers ranked by the number of invoices generated during the fiscal year.
Dormant Customers
- Displays a list of dormant customers who have had no recent activity or transactions.
Top 10 Highest Sales Invoice (Fiscal Year)
- Presents a list of the top 10 customers with the highest individual sales invoices recorded in the fiscal year.
Inactive High-Value Customers
- Shows a graphical analysis of high-value customers who are currently inactive.
Top 10 Number of Overdue Invoices
- Displays a chart showing the top 10 customers with the highest number of overdue invoices.
Fast Payers vs Late Payers (By Invoice Date & Full Paid Date Average)
- Provides a graphical view comparing customers based on their average payment timelines, highlighting fast and late payers calculated using invoice and full payment dates.
Fast Payers vs Late Payers (Due Term Payment Average)
- Displays two comparative charts illustrating customer payment behavior based on the due term payment averages, distinguishing between fast and late payers.
Tickets
The Tickets section provides a detailed overview and analytics of customer support and issue-tracking activities. It helps businesses monitor ticket volumes, response performance, and team efficiency in handling customer queries and issues.
Ticket Summary Metrics
The following key metrics are displayed:
Total Tickets Count: Total number of tickets recorded in the system.
Today's Ticket Count: Number of tickets created on the current day.
Tickets in This Month Count: Number of tickets created during the current month.
Tickets in Past Month Count: Number of tickets created during the previous month.
Total Open Tickets Count: Total number of currently open tickets.
Today's Open Ticket Count: Open tickets created on the current day.
Open Tickets in This Month Count: Total number of open tickets created in the current month.
Open Tickets in Past Month Count: Open tickets recorded in the previous month.
Unassigned Tickets Count: Number of tickets not yet assigned to any user.
My Assigned Ticket Count: Number of tickets assigned to the logged-in user.
Overdue Ticket Count: Total number of tickets that have passed their due dates.
Due Tickets Count: Tickets that are due within the current time period.
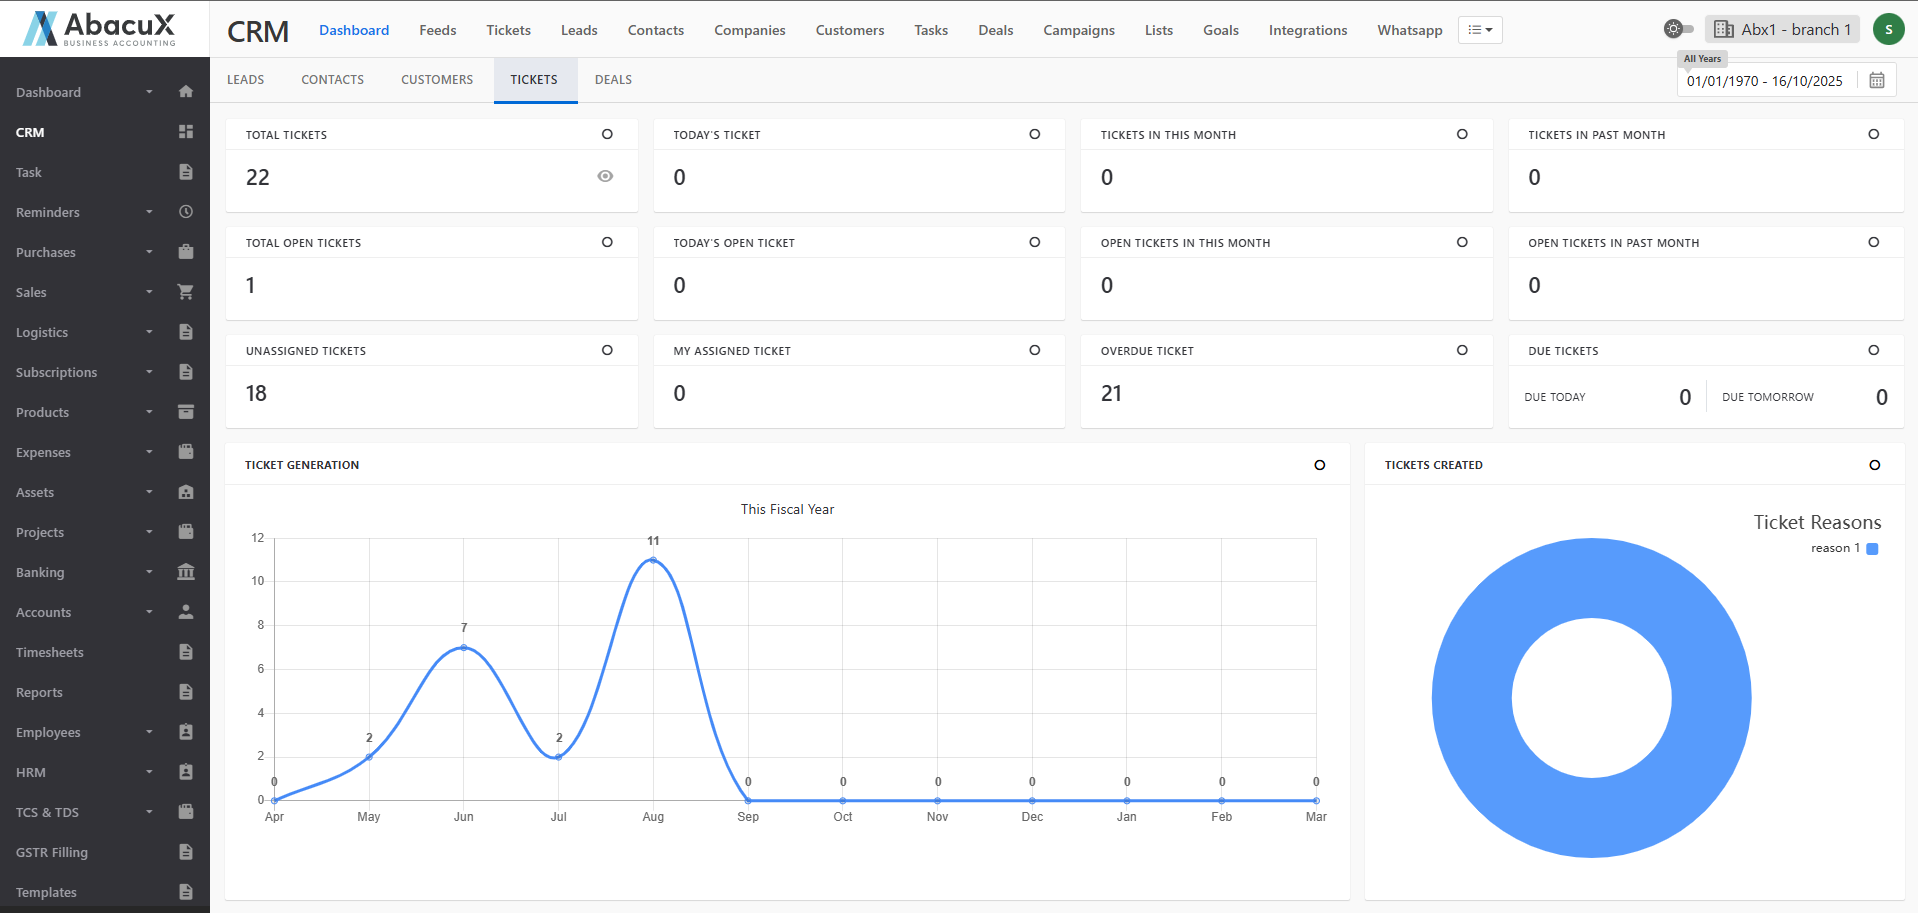
Ticket Analytics and Reports
Ticket Generation
- Displays a chart view of all tickets generated during the fiscal year.
Tickets Created by Reasons
- Presents a graphical view categorizing tickets based on the reasons for their creation.
Tickets by Day of Week
- Displays a chart view illustrating ticket distribution across different days of the week.
Tickets Created by Sources
- Shows a graphical representation of tickets created from various sources (e.g., email, web, phone).
Closed Ticket vs New Ticket vs Open Ticket
- Displays a comparative chart representing the number of closed, new, and open tickets within a selected period.
Tickets by Status
- Presents a status-based chart view of tickets (e.g., open, closed, in progress).
Ticket Summary - Assignee Summary
- Displays each assignee’s performance, including the number of assigned tickets and their statuses.
Tickets Priority
- Shows a graphical view of tickets categorized by priority levels (e.g., low, medium, high, urgent).
Ticket Priority by Assignee
- Displays a chart representing ticket priorities for each assignee.
Tickets by Months
- Presents a monthly graphical analysis of tickets created throughout the year.
Current Ticket Status
- Displays the current state of tickets, including open, closed, and assigned tickets in a graphical format.
Ticket Status Analysis
The Ticket Status section contains three tabs:
- Created
- Resolved
- Unresolved
Each tab provides three subsections:
-
Tickets Created:
- Displays the total number of tickets created under the respective category.
-
Tickets Created by Priority:
- Shows a graphical view of tickets categorized based on their priority.
-
Tickets Created Trend:
- Displays a trend analysis chart showing ticket creation patterns throughout the fiscal year.
Tickets Created by Source
- Presents a graphical view of tickets categorized based on their creation source.
Tickets Created by Stage
- Displays a chart view showing tickets grouped by their workflow stage.
Tickets Created by Status
- Shows a graphical analysis of tickets based on their current status.
Deals
The Deals section provides a detailed overview of all sales opportunities and their performance within the CRM. It enables businesses to track progress, measure success rates, and analyze revenue trends at various deal stages.
Deal Summary Metrics
The following key details are displayed:
Total Deals Count: Displays the total number of deals created in the system.
Deals: Shows the count of deals categorized as Won Opportunities and Lost Opportunities.
Revenue: Displays the Win Revenue Amount and Lost Revenue Amount based on deal outcomes.
Total Value of Deals: Shows the combined total value of Won Deals and Deals in Progress.
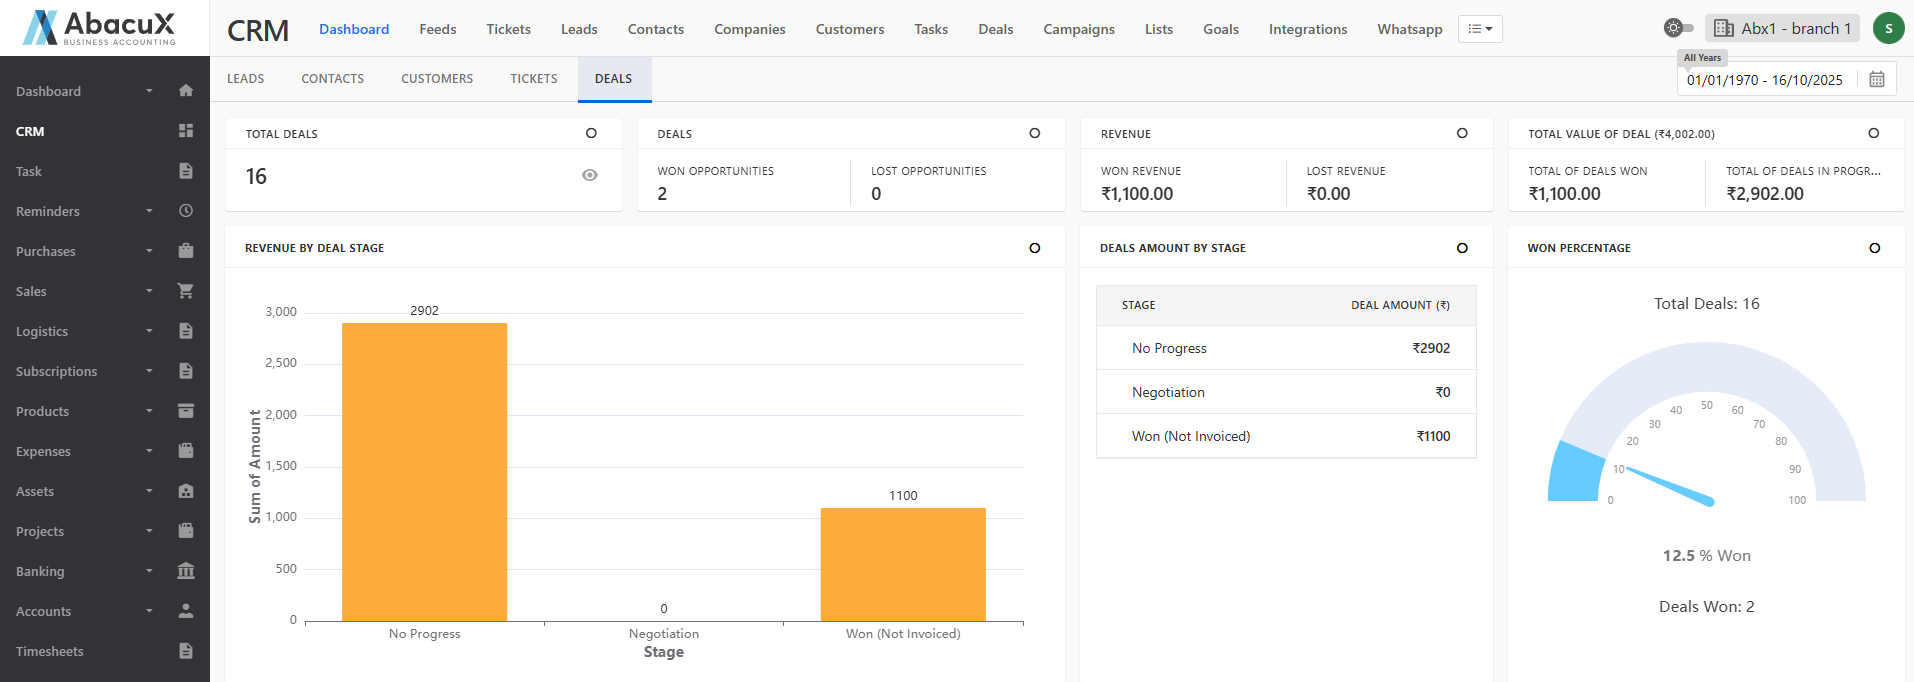
Deal Analytics and Reports
Revenue by Deal Stage
- Displays a graphical representation of revenue distribution across different deal stages.
Deals Amount by Stage
- Lists the deal amounts categorized according to their current stage in the sales pipeline.
Won Percentage
- Shows a graphical view indicating the percentage of deals successfully closed (won) compared to total opportunities.
Deals by Stage
- Presents a chart view illustrating the distribution of deals across various sales stages.
Deals by Status
- Displays a graphical representation of deals based on their current status, such as Open, Won, or Lost.
Deals by Type of Business
- Shows a graphical analysis of deals categorized by the type of business or industry segment.
Deals Count
- Displays a monthly chart view showing the number of deals created in each month of the fiscal year.
Top 10 Revenue Won by Assignee
- Presents a graphical view of the top 10 assignees ranked by the total revenue generated from their won deals.