Dashboard
The dashboard provides a comprehensive overview of the company's key financial metrics in a single view. It displays information such as total cash, total sales value, total purchase value, total salary, total bank balance, total receipts, total purchase payments, a graphical representation of sales analytics, and the status of sales invoices, among other details.
Overview
Total Cash
Represents the total available physical cash on hand across all cash accounts.
✅ Includes:
-
All transactions marked as "Cash In"
-
Opening cash balance
-
Cash received from sales, refunds, or other income
-
Cash not yet deposited into bank
✅ Excludes:
-
Pending cash transfers to bank
-
Cash that is earmarked or allocated for specific purposes but not yet used
Total sales value
Shows the cumulative value of all confirmed Sales Invoices and POS Invoices generated in the system.
✅ Includes:
-
Tax-inclusive invoice amounts
-
Manual sales and POS (point-of-sale) entries
-
AMC and Recurring Sales invoices
✅ Excludes:
-
Quotes and draft invoices
-
Cancelled or returned sales
Total purchase value
Shows the total value of all confirmed Purchase Bills recorded in the system.
✅ Includes:
-
Multi-vendor Purchase Orders converted into bills
-
Manually created purchase bills
-
GST and other taxes if included in bill amount
✅ Excludes:
-
Draft or unapproved purchases
-
Cancelled or rejected bills
Total expenses
Displays the total value of all business operating expenses logged via Expense Bills.
✅ Includes:
-
Utility bills, rent, travel, admin expenses, etc.
-
Both one-time and recurring expenses
✅ Excludes:
-
Unsubmitted expense claims
-
Cancelled or rejected expenses
Total salary
Displays the total gross salary to be paid to employees based on approved payroll runs.
✅ Includes:
-
All employee salary amounts (basic + allowances)
-
Approved payroll entries
✅ Excludes:
-
Payroll drafts or unapproved runs
-
Deductions, reimbursements, or loans
Total bank balance
Reflects the total current balance in all linked bank accounts, updated in real-time or per reconciliation.
✅ Includes:
-
Bank account balances from all connected bank ledgers
-
Bank receipts from customers, loan disbursements, or refunds
✅ Excludes:
-
Uncleared cheques
-
Scheduled (future dated) payments not yet processed
Total receipts
Displays the total amount received from customers against sales, advances, or outstanding dues.
✅ Includes:
-
Direct payments (cash/bank)
-
Agent collections or branch collections
-
Partial and full receipts
✅ Excludes:
-
Receivables not yet paid
-
Overdue or pending collections
Total purchase payments
Shows the total amount paid to vendors or suppliers for purchase transactions.
✅ Includes:
-
Full and partial payments made for Purchase Bills
-
Direct payments (advance or on delivery)
✅ Excludes:
-
Pending dues to vendors
-
Debit notes or returns not adjusted
Total Expense Payments
Shows the total amount paid out for recorded expenses.
✅ Includes:
-
Cash, bank, cheque, or online payments
-
Full or partial payments for Expense Bills
✅ Excludes:
-
Unpaid expenses
-
Future-dated scheduled expense payments
Total Salary Payments
Shows the total amount disbursed to employees for salary purposes.
✅ Includes: Net paid salary (after deductions)
-
Salary advances and full settlements
-
Bank transfers or cash payments
✅ Excludes:
-
Salaries not yet paid
-
Pending or scheduled salary payments
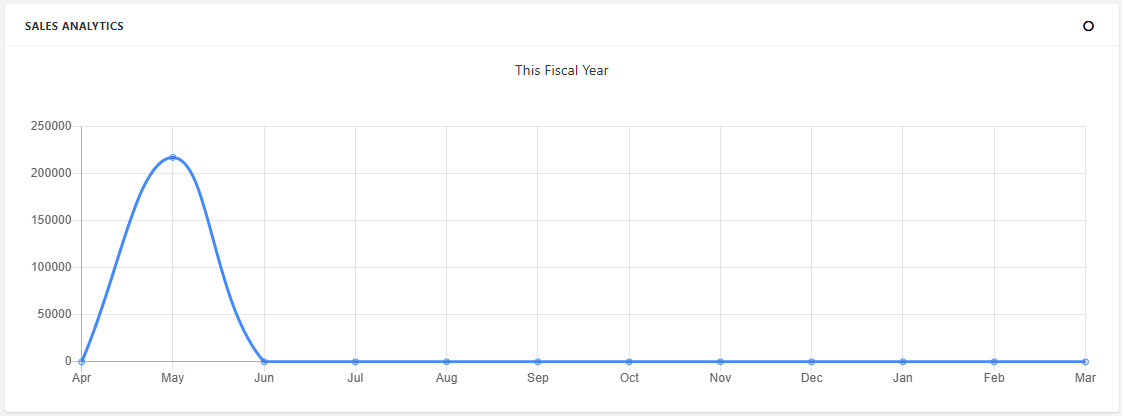
Sales analytics
The Sales Analytics section of your ERP Dashboard presents a visual representation of sales performance over time, enabling management and sales teams to make data-driven decisions quickly and effectively.
✅ Purpose
-
The Sales Analytics chart helps users:
-
Track sales trends over time (daily, weekly, monthly, yearly)
-
Compare sales volume and value
-
Identify peak sales periods
-
Monitor performance of sales channels or categories
-
Forecast future sales growth
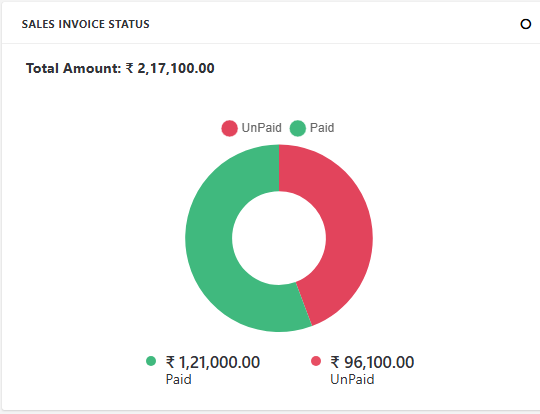
Sales Invoice Status
The Sales Invoice Status Donut Chart on the ERP Dashboard provides a visual breakdown of all sales invoices based on their current status. This chart gives a quick, at-a-glance summary of how many invoices are in each stage, helping users assess billing progress and identify pending or problematic transactions.
✅ Purpose
-
The Donut Chart helps users:
-
Monitor the flow of invoices
-
Quickly identify bottlenecks (e.g., too many unpaid or pending invoices)
-
Analyze billing and collection trends
-
Ensure timely follow-up for due or overdue invoices
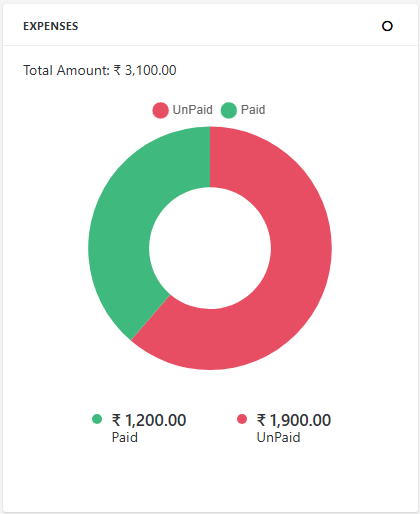
Expenses
The Expenses Status Donut Chart in the ERP Dashboard provides a clear visual breakdown of all expense bills based on their payment status—Paid vs Unpaid. It helps businesses track and control operating expenses efficiently.
✅ Purpose
-
The chart helps users:
-
Visually compare paid vs outstanding expense amounts
-
Monitor financial obligations in real time
-
Ensure timely clearance of vendor or operational expenses
-
Enhance visibility into monthly or periodic spending behavior
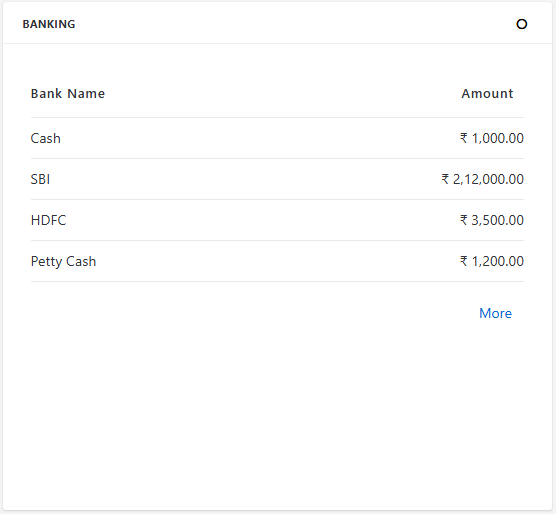
Banking
The Banking Details Table on the ERP Dashboard presents a real-time summary of all connected bank accounts, along with their current balances. This feature gives users a clear and consolidated view of their available bank funds for financial planning and decision-making.
✅ Purpose
-
This dashboard widget helps users:
-
Monitor available funds across all bank accounts
-
Track balances to manage payments, transfers, and investments
-
Improve visibility into financial health and liquidity
-
Detect anomalies in balances quickly
Top Sales Products Analytics
The Top Sales Products Analytics chart provides a visual breakdown of the highest-selling products, ranked by sales percentage within a selected time frame. This helps businesses identify demand trends and optimize inventory, pricing, and promotions.
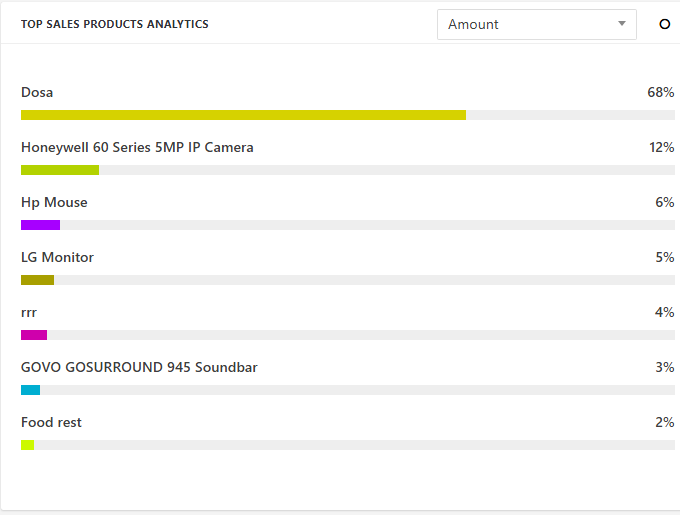
✅ Purpose
-
This chart helps users:
-
Identify the best-performing products by sales volume or revenue
-
Understand product demand trends
-
Make informed decisions on stock replenishment and promotions
-
Track product performance over time
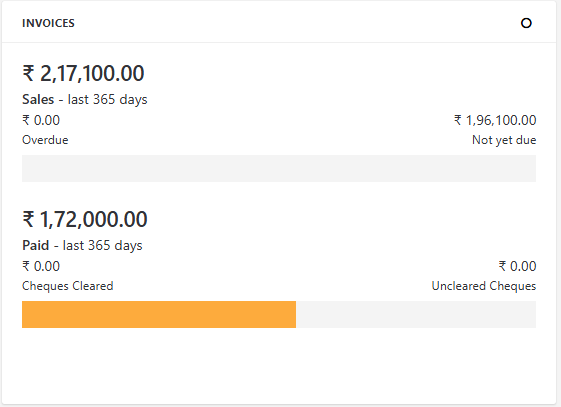
Invoices
The Invoices Analytics Bar Chart provides a quick visual comparison between total sales invoices generated and invoices that have been paid, giving users a real-time sense of outstanding receivables and cash flow health.
✅ Purpose
-
This chart helps businesses:
-
Track billing vs collections over time
-
Identify cash flow gaps and follow up on unpaid invoices
-
Monitor sales performance and collection efficiency
-
Support credit management decisions
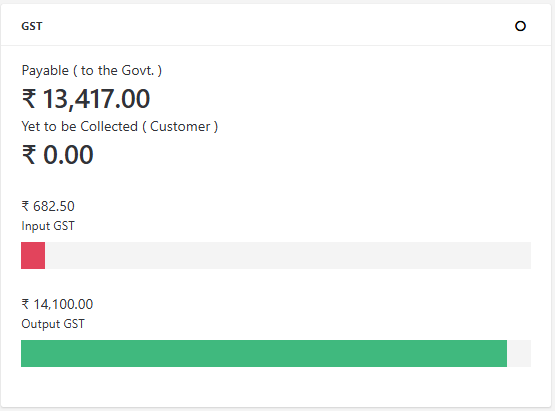
GST
The GST Details section on your ERP dashboard provides a snapshot of the Goods and Services Tax flow within your business operations, enabling compliance and accurate reporting. This helps you stay aware of your tax liabilities and credits in real time.
✅ Key Metrics Displayed
Input GST
Definition: GST paid on purchases, expenses, or imports (i.e., when the business buys goods or services).
Source: Automatically calculated from purchase bills, expense bills, or import entries.
Example: You purchase raw materials worth ₹1,00,000 with 18% GST → Input GST = ₹18,000.
Output GST
Definition: GST collected on sales to customers.
Source: Comes from Sales Invoices, POS Invoices, and Recurring Sales Invoices.
Example: You sell goods worth ₹2,00,000 with 18% GST → Output GST = ₹36,000.
GST Payable
Definition: The net GST that the business must pay to the government.
GST Payable = Output GST - Input GST
If Input GST > Output GST, the excess is a credit (carry-forward).
If Output GST > Input GST, this becomes the payable amount.
Yet to Be Collected GST
Definition: GST amounts from sales invoices that are not yet paid by customers.
Purpose: Shows how much Output GST is still pending collection.
Source: From unpaid or partially paid invoices
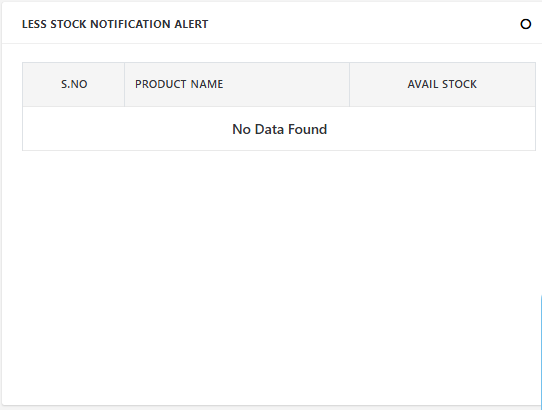
Less Stock Notification Alert
The Less Stock Notification Alert feature helps businesses monitor their inventory levels in real-time by showing a table of products whose available stock has fallen below a defined threshold. This helps ensure timely reordering, avoids stockouts, and maintains smooth operations.
✅ Purpose
-
Prevents stockouts and missed sales
-
Enables proactive restocking
-
Provides a quick summary of critical inventory levels
-
Aids in better purchase planning
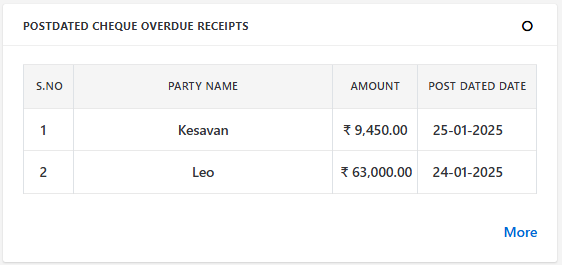
Postdated Cheque Overdue Receipts
The Postdated Cheque (PDC) Overdue Receipts section on your ERP dashboard lists all received cheques that were expected to be cleared by a specific date but haven't been realized yet. This helps your finance or accounts team track delayed or bounced payments, improve follow-up actions, and ensure cash flow accuracy.
✅ Purpose
-
Highlight pending cheque receipts that are past their due (clearance) date
-
Improve cash inflow visibility
-
Support timely customer follow-up and reduce bad debts
-
Enhance financial control and liquidity management
General Reminders
The General Reminders section is a utility feature on your ERP dashboard designed to help users track important tasks, notices, or deadlines across departments. These reminders ensure no critical actions are missed, enhancing operational efficiency and accountability.
✅ Purpose
-
Acts as a virtual sticky note system for business-wide reminders
-
Helps teams remember upcoming deadlines, events, or pending tasks
-
Centralizes important notices (e.g., payment follow-ups, document renewals, tax filings)
-
Prioritizes tasks based on urgency
Recurring Expenses
The Recurring Expenses section of the ERP dashboard helps businesses track and monitor periodic expenses such as rent, utility bills, software subscriptions, maintenance charges, and service contracts. These expenses are recorded based on a predefined schedule (daily, weekly, monthly, etc.) and ensure financial planning accuracy and automation.
✅ Purpose
-
Provide visibility into regularly scheduled business expenses
-
Prevent missed or duplicated payments
-
Help in budgeting and financial forecasting
-
Track recurring commitments with proper documentation
Employee Attendance Report
The Employee Attendance Report on the dashboard provides a real-time view of employee attendance for the current day. This section gives HR, managers, and administrators an at-a-glance summary of who is present, absent, or late, including their check-in and check-out times.
✅ Purpose
-
Track daily attendance of employees
-
Ensure accountability and punctuality
-
Provide a quick overview for HR and team leads
-
Help monitor shift discipline and absenteeism patterns
Employee Attendance Report ( FY )
The Employee Attendance Report for the financial year provides a comprehensive summary of each employee’s presence and absence. It gives HR and management a holistic view of employee attendance behavior, useful for performance evaluation, payroll processing, and annual reviews.
✅ Purpose
-
Analyze long-term attendance trends
-
Help in salary computation and compliance
-
Enable year-end HR evaluations and appraisals
-
Support leave and disciplinary tracking
Product Sales and Delivery Report
This dashboard section visualizes the Sales vs. Delivery performance of products over selected time intervals. It helps management quickly assess product movement trends, fulfillment efficiency, and operational bottlenecks.
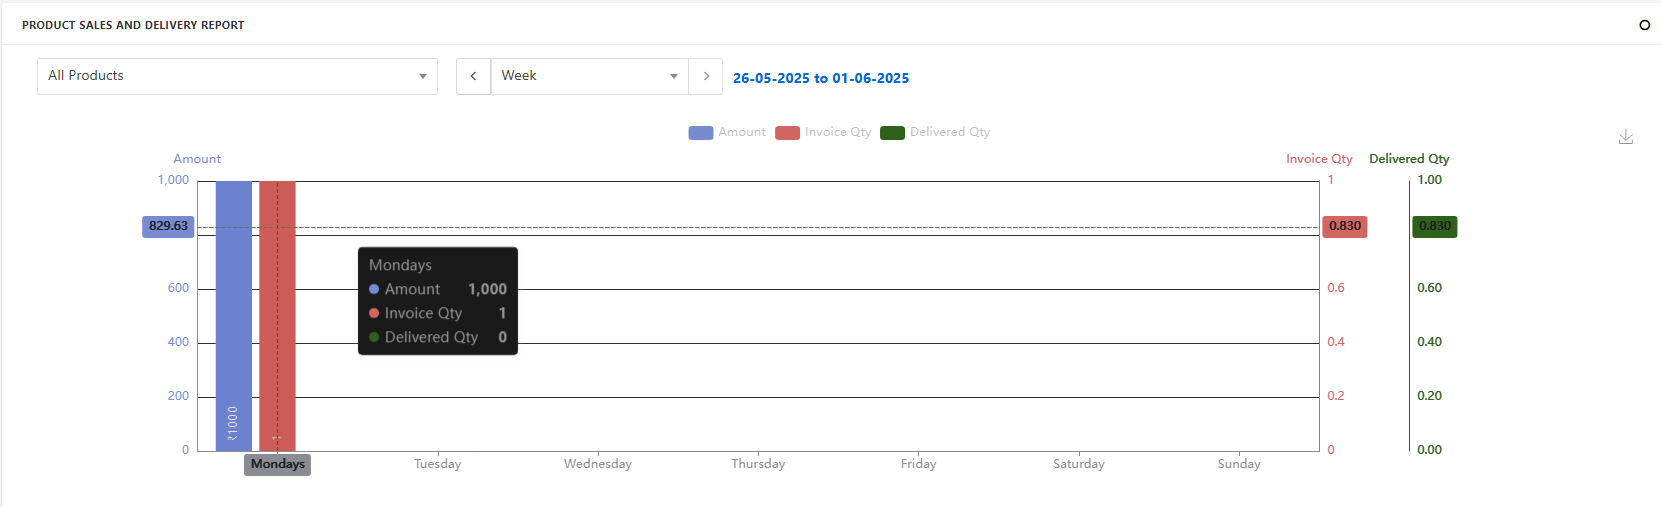
✅ Purpose Track how many units were sold vs. delivered
-
Analyze performance trends over time
-
Monitor fulfillment efficiency
-
Identify high/low-moving products
-
Compare weekly, monthly, and yearly statistics